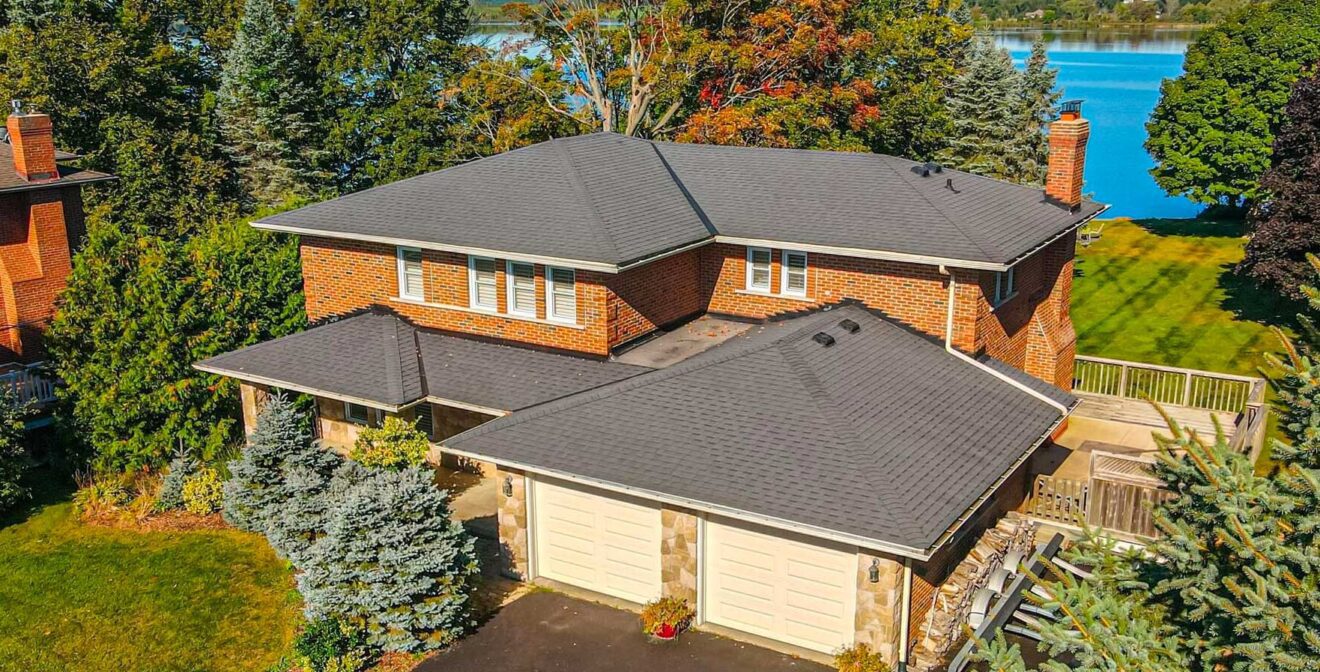
March 2025 vs. March 2024. Here’s a quick and friendly look at how this year’s housing market stacks up against last year’s in Durham Region.
📈 More Homes on the Market
This March (2025), there were 1,937 new listings—that’s a 24% increase from March 2024. More homes for sale = more choices for buyers and more competition for sellers.
📉 Fewer Sales
Only 671 homes sold this March, compared to 829 last year—a 19% drop. Buyers are being pickier and taking their time, which is totally normal in a shifting market.
💸 Slight Dip in Prices
- Average Price: Down from $928,897 in 2024 to $911,396 in 2025 — a 2% decrease.
- Median Price: Also slipped from $865,000 to $850,000.
So, prices are slightly softer, which is good news for buyers and still solid for sellers.
🕒 Homes Are Taking a Bit Longer to Sell
- Days on Market: Homes now take 17 days to sell, up from 14 days last year.
It’s not a dramatic change, but shows that buyers aren’t rushing.
📦 More Inventory = Buyer Advantage
- Months of Inventory (MOI) tells us how long it would take to sell all current listings if no new homes came on the market.
- March 2024 MOI: 1.9 months
- March 2025 MOI: 3.0 months
This jump means there’s more supply and homes aren’t moving quite as fast—another plus for buyers.
- March 2024 MOI: 1.9 months
⚖️ Market Shift: More Power to Buyers
- The Sales-to-New-Listing Ratio dropped from 45.1% last year to 34.6% this year.
That officially puts us into buyer’s market territory, where buyers have the upper hand in negotiations.
📝 In a Nutshell
Compared to last year, March 2025 brings:
✅ More homes for sale
✅ Fewer homes selling
✅ Slightly lower prices
✅ More time to make decisions
✅ A buyer-friendly market
🎯 If You’re Buying: You’ve got more options and negotiating power.
📣 If You’re Selling: Be strategic—price right and present your home at its best to stand out.
Durham Region by Municipality – March 2025 Snapshot
(All percentages are year to date versus last year to date)
Ajax
- 🏠 Average Price: $916,037
- 📉 Sales: 99 (⬇️ 6%)
- 🏷️ New Listings: 258 (⬆️ 43%)
- 🗓️ Days on Market: 15 (Up from 13)
- 📦 MOI (Months of Inventory): 2.5 (up from 1.1)
- Sales-to-New-Listing Ratio: 38.4% (down from 62%)
Brock
- 🏠 Average Price: $898,214
- 📉 Sales: 7 (⬇️ 33%)
- 🏷️ New Listings: 34 (⏸️ same as last year)
- 🗓️ Days on Market: 18 (Up from 17)
- 📦 MOI: 7.4 (Up from 3.2)
- 🔁 SNLR: 20.6% (Down from 40.0%)
Clarington
- 🏠 Average Price: $893,731
- 📉 Sales: 122 (⬇️ 28%)
- 🏷️ New Listings: 290 (⬆️ 10%)
- 🗓️ Days on Market: 17. (Up from 15)
- 📦 MOI: 2.3 (Up from 1.0)
- 🔁 SNLR: 42.1% (Down from 60.0%)
Oshawa
- 🏠 Average Price: $769,748
- 📉 Sales: 184 (⬇️ 21%)
- 🏷️ New Listings: 534 (⬆️ 21%)
- 🗓️ Days on Market: 18 (Up from 13)
- 📦 MOI: 3.0. (Up from 0.9)
- 🔁 SNLR: 34.5% (Down from 60.8%)
Pickering
- 🏠 Average Price: $964,971
- 📉 Sales: 108 (⬇️ 6%)
- 🏷️ New Listings: 341 (⬆️ 38%)
- 🗓️ Days on Market: 17 (Up from 16)
- 📦 MOI: 3.3. (Up from 1.3)
- 🔁 SNLR: 31.7%. (Down from 49.6%)
Scugog
- 🏠 Average Price: $1,286,923
- 📉 Sales: 13 (⬇️ 19%)
- 🏷️ New Listings: 48 (⬆️ 19%)
- 🗓️ Days on Market: 25 (Up from 21)
- 📦 MOI: 5.8 (Up from 2.3)
- 🔁 SNLR: 27.1% (Down from 42.2%)
Uxbridge
- 🏠 Average Price: $1,152,769
- 📉 Sales: 26 (⬇️ 16%)
- 🏷️ New Listings: 63 (⬆️ 25%)
- 🗓️ Days on Market: 20 (Down from 28)
- 📦 MOI: 3.2 (Up from 1.9)
- 🔁 SNLR: 41.3% (Down from 57.5)
Whitby
- 🏠 Average Price: $1,008,786
- 📉 Sales: 112 (⬇️ 26%)
- 🏷️ New Listings: 369 (⬆️ 23%)
- 🗓️ Days on Market: 16. (Up from 13)
- 📦 MOI: 3.3. (Up from 0.8)
- 🔁 SNLR: 30.4%. (Down from 63.1%)
📞 Thinking about buying or selling? Let’s chat! We’lll help you make the most of today’s market.
Click here to book a call on our calendar or send us an email to: team@willowsgroup.ca

Stay connected to the market.
Sign up to our digital newsletter community.


